 An official website of the United States government.
  Official websites use .gov
A .gov website belongs to an official government organization in the United States.
Official websites use .gov
A .gov website belongs to an official government organization in the United States. Secure .gov websites use HTTPS
A lock or https:// means you’ve safely connected to the .gov website. Share sensitive information only on official, secure websites..
Secure .gov websites use HTTPS
A lock or https:// means you’ve safely connected to the .gov website. Share sensitive information only on official, secure websites..
About HF Radar
High frequency (HF) radar systems measure the speed and direction of ocean surface currents in near real time. Currents in the ocean are equivalent to winds in the atmosphere because they move things from one location to another. These currents carry nutrients as well as pollutants, so it is important to know the currents for ecological and economic reasons. The currents carry any floating object, which is why U.S. Coast Guard search and rescue operators use HF radar data to make critical decisions when rescuing disabled vessels and people stranded in the water.
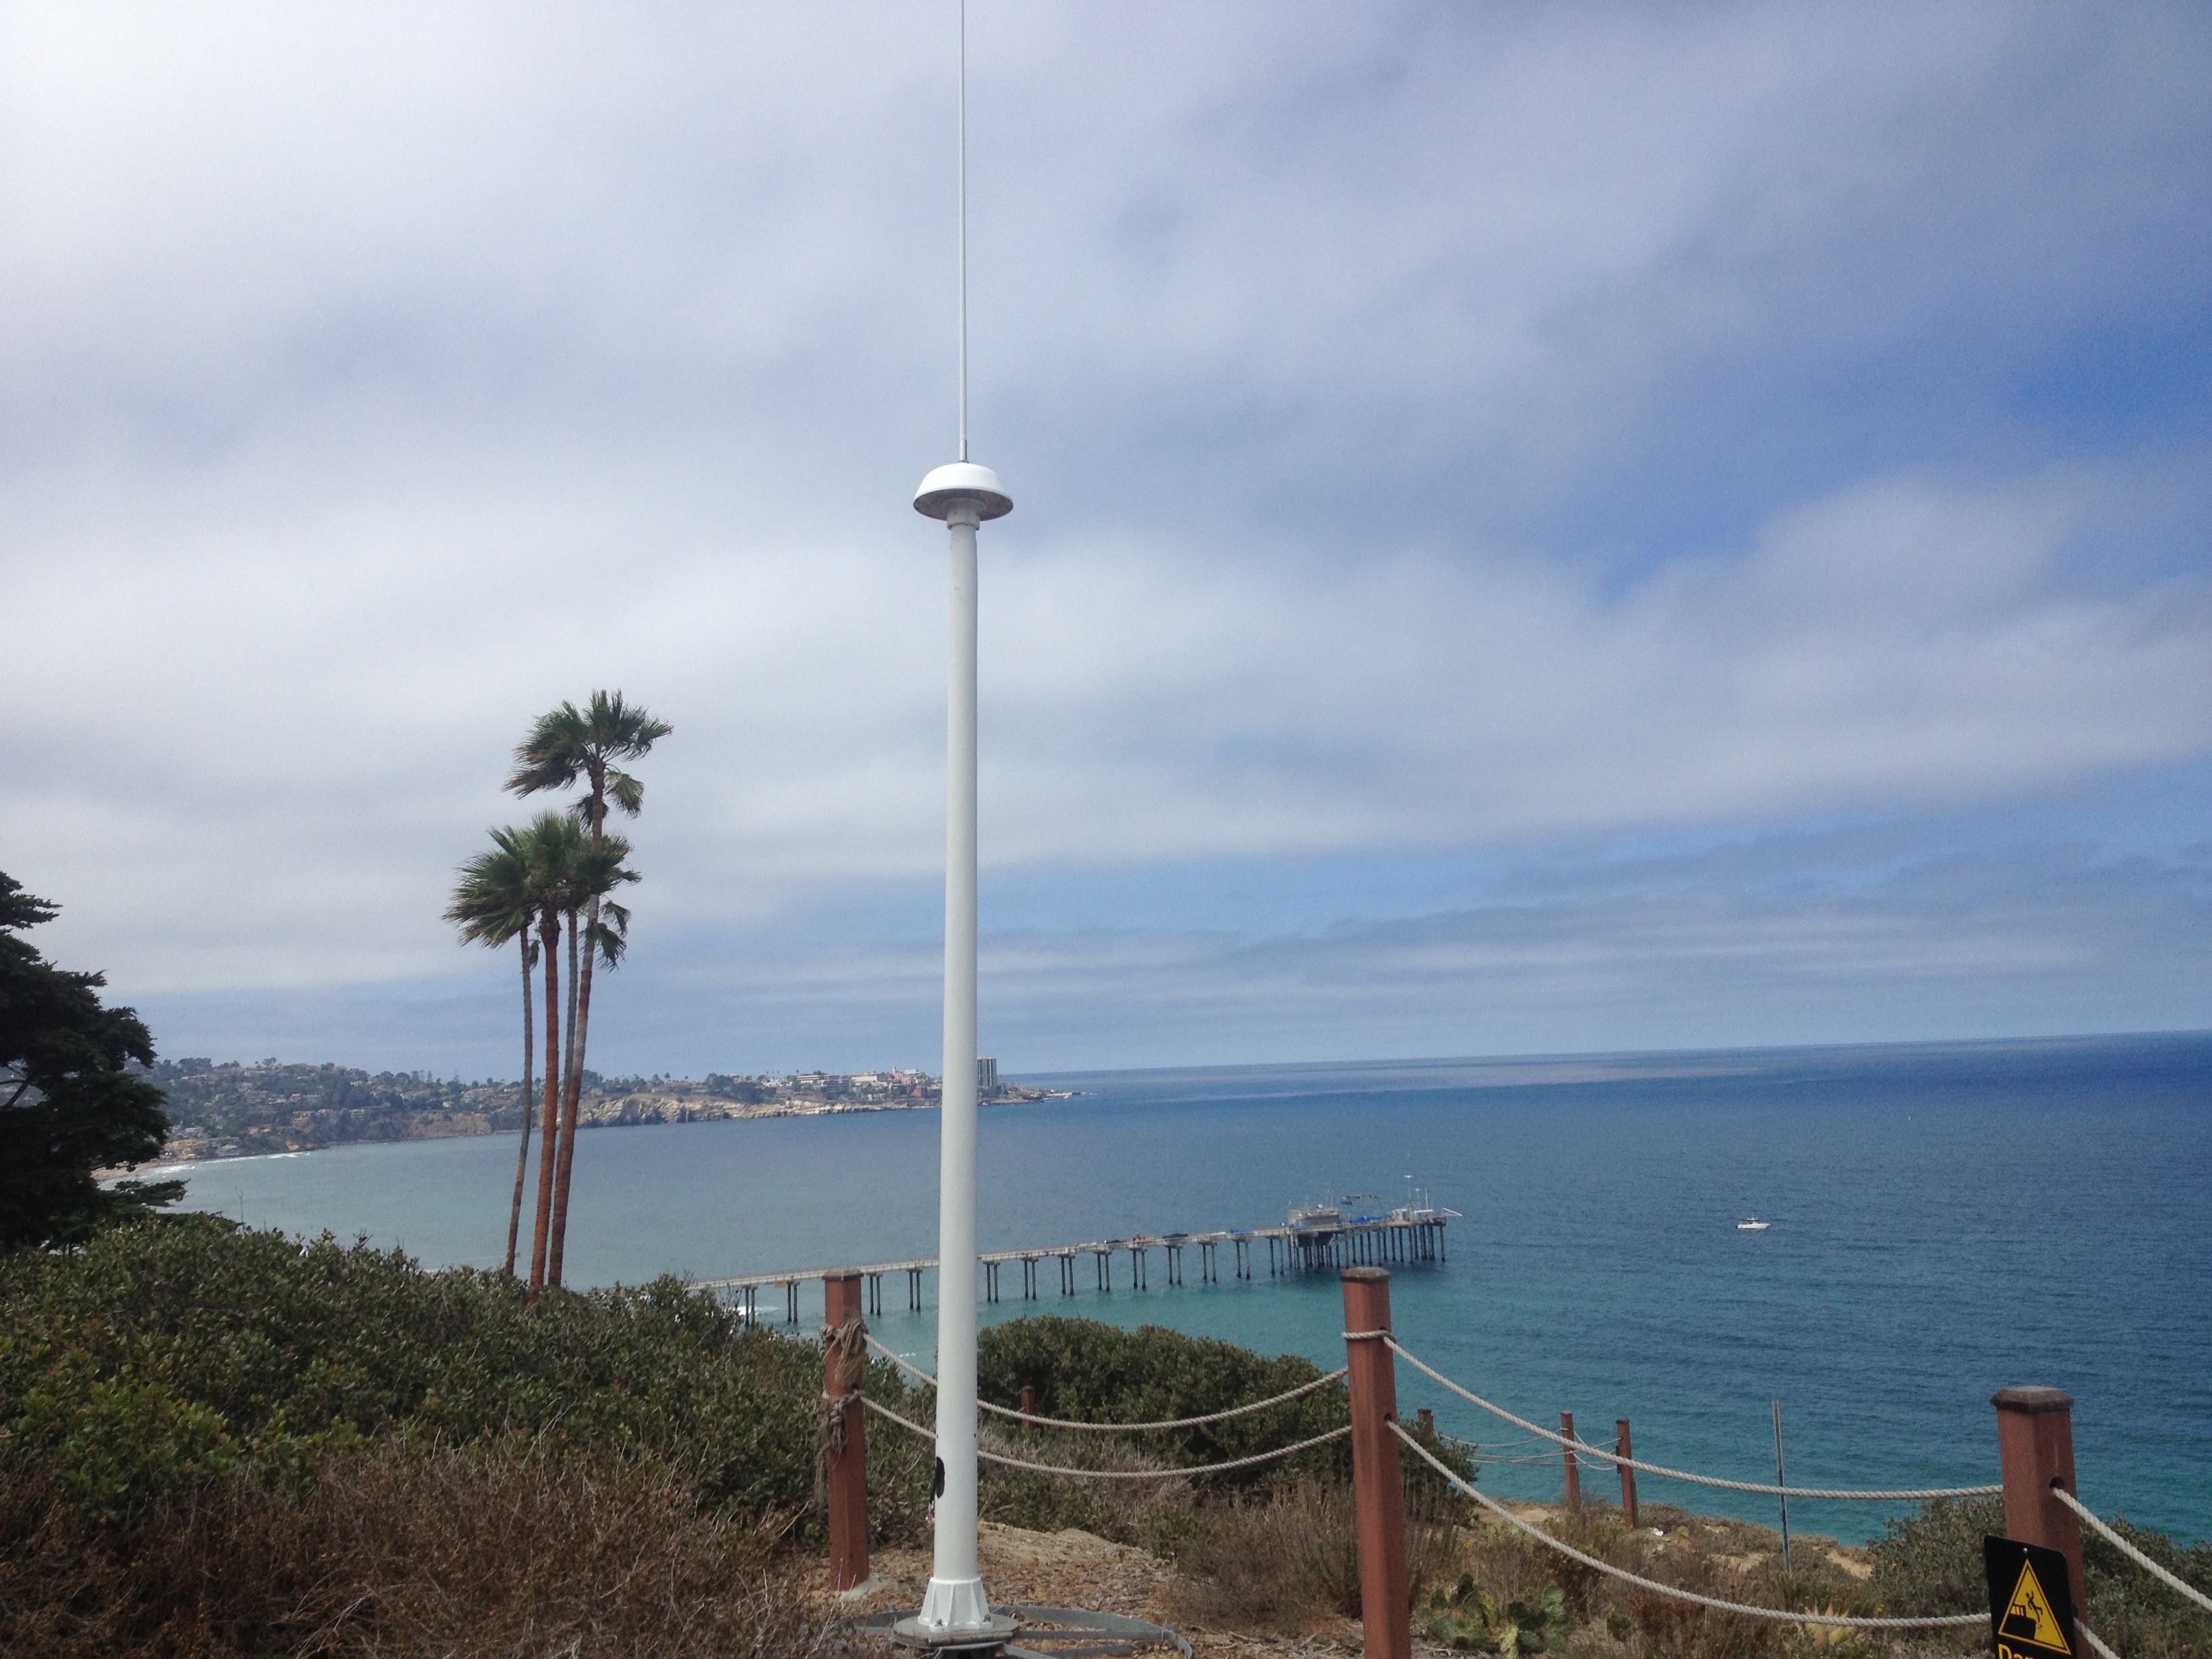
These radars can measure currents over a large region of the coastal ocean, from a few kilometers offshore up to about 200 km, and can operate under any weather conditions. They are located near the water’s edge, and need not be situated atop a high point of land. Traditionally, crews placed current measuring devices directly into the water to retrieve current speeds. While these direct measurement systems are still widely used as a standard reference, HF radars are the only sensors that can measure large areas at once with the detail that is required for the important applications described here. Not even satellites have the temporal and spatial resolution for coastal ocean current measurement. A 5-minute video about IOOS HF radar is on Youtube here
The Mission
Coast Guard Search and Rescue
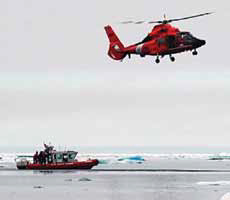
U.S. Coast Guard operations off Alaska. (USCG)
The U.S. Coast Guard integrated HF radar data into its Search and Rescue system in the mid-Atlantic region in 2009 and later the data were made available for all USCG SAR teams via the Coast Guard’s Environmental Data Server (EDS). IOOS-funded Short-term Prediction System (STPS) predicted flows based on the HF radar data are also available in the EDS.
Click here for real-time predictions for the northeastern coastal areas.
Hazardous Materials Spills Response
NOAA is responsible for providing scientific support to the Federal On-Scene Coordinator for oil and hazardous material spills. To support this mandate, NOAA’s Office of Response and Restoration Emergency Response Division provides 24-hour, 7 day a week response to spill events. High frequency radar data are often used to help forecast where the oil or other material will flow.
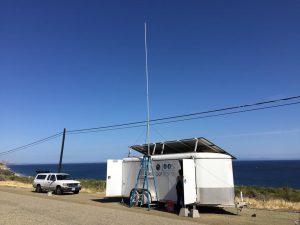
Temporary HF radar site, housed inside a trailer, at Gaviota, California in response to the Refugio Beach oil spill.
In May 2015, an onshore oil pipeline burst which sent oil flowing into the Pacific Ocean in the area of Refugio State Beach Park. Although existing radars, operated by University of California-Santa Barbara (UCSB), covered a large portion of the local coastline, a temporary HF radar site was quickly installed by UCSB to add radar coverage north of the spill. The data were easily ingested because of the work IOOS has done to establish HF radar as a national network.HF radar-derived surface currents were used by NOAA Office of Response and Restoration (ORR) and CA State Office of Spill Prevention and Response (OSPR) to help predict the flow of the oil in the coastal waters. SCCOOS HF radar visualizations were used by local News Channel 3 in Santa Barbara during the weathercast in order to show circulation patterns in the area. UCSB also ran a local trajectory model advecting simulated particles through the current field to visualize the potential path of the slick.
During the 2010 Deepwater Horizon oil spill, HF radar data were used in near real-time for the duration of the oil spill response efforts. Crews used regionally-operated IOOS radars in the Gulf Coast and Southeast at sites along Florida’s West Coast and the northern Gulf to monitor the oil’s surface travels. NOAA immediately used these data to provide science-based daily oil trajectory maps. Because IOOS members in Southern California previously worked with NOAA on a five-year effort to develop usable formats for HF radar data, this effort proved seamless when needed most. An example of the NOAA Office of Response and Restoration's trajectory forecast that used HF radar data during the spill is here.
A large cargo ship, the Cosco Busan, collided with the Bay Bridge in San Francisco Bay in November 2007 causing a breach in the hull, which spilled fuel from its tanks. As NOAA’s Emergency Response Division tracked the spill, they used HF radar data to determine that the spill would not reach the Farallon Islands marine sanctuary off the coast of San Francisco. This allowed spill responders to focus their equipment and manpower on more threatened areas.
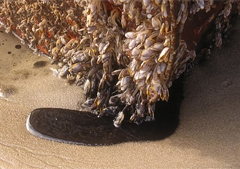
Water Quality Monitoring
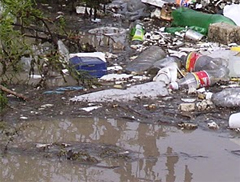
Water quality - trash in the water.
Water Quality monitoring aids decision making.
In 2008, the City and County of San Francisco’s wastewater system managers used HF radar data. They used daily forecasts based on these data to decide whether to close nearby beaches after finding a defect in the wastewater system would cause a point-source discharge of partially-treated wastewater.
The City of San Diego, Department of Environmental Health uses the Tijuana River Plume Trajectory, which relies on HF radar data, to help guide decisions about water sampling and beach closures.
In November 2006, the City of Los Angeles used HF radar data to make decisions about beach closures during a major maintenance operation on a 50-year-old outflow pipe. City officials estimate that they could have avoided $750 million in unneeded repairs in previous years, had HF radar data been available then.
Marine Navigation
High frequency radar data are a core component of a simple but very effective near real time, customized, interactive websitedisplaying environmental conditions at the entrance to the Ports of Los Angeles and Long Beach. Another navigation product is provided by the National Ocean Service Center for Operational Oceanographic Products and Services (CO-OPS). This product creates tidal predictions using HF radar data for Chesapeake Bay, New York Harbor and San Francisco Bay.
History
(from Harlan et al, Marine Technology Society Journal, Vol. 44, No. 6, 2010)
The present state of the U.S. national high-frequency (HF) radar network has resulted from nearly 40 years of research and applications. HF radar observations of the ocean surface truly began with Crombie’s (1955) experimental discovery of the mechanism behind his puzzling analog sea-echo spectral plots. Don Barrick (1968, 1972) theoretically derived the model that indeed showed that this resonant scatter was in fact “Bragg scatter” and related the echo strength to the ocean wave height spectrum at the Bragg wave number. Barrick was invited to present his results at seminars in Boulder, Colorado, as the National Oceanic and Atmospheric Administration (NOAA), and its Boulder laboratories were being formed in 1970. A group was formed within NOAA’s new Environmental Research Laboratories to build a compact antenna system to be used for coastal ocean surface current mapping. This was the Coastal Ocean Dynamics Applications Radar (CODAR) program. After demonstrating its effectiveness, the NOAA/ National Ocean Service formed a Transitional Engineering Program in 1978 to encourage development of a commercial version of CODAR. With only a small potential market, no existing radar companies were interested in commercializing CODAR so a small group left NOAA to start CODAR Ocean Sensors, Ltd. in the early 1980s. In the 1990s, the Office of Naval Research and the National Science Foundation funds were used to acquire radars at several universities including the Oregon State University, the Rutgers University, the University of California-Santa Barbara, the Naval Postgraduate School, the University of Rhode Island, and the University of Connecticut. This was followed by a surge in acquisition because of the National Oceanographic Partnership Program, an NOAA/Office of Naval Research/National Science Foundation program that funded coastal oceanographic research at many of these same universities. In 2002, California voters approved funds that led to a program called the Coastal Ocean Currents Monitoring Program, which allowed for the investment of $21 million to create a California network of HF radars to measure ocean surface currents to ensure the monitoring of coastal water quality. The acquisition began in 2005 with 40 CODAR radars eventually being integrated with the then-existing 14 CODARs in California. On a national scale, the Integrated Ocean Observing System (IOOS®) Program developed a national data management and distribution system for all U.S. HF radars as well as radars operated by investigators in Canada and Mexico. Presently, approximately 150 HF radars and 30 institutions are part of the network, and their data are delivered by IOOS national data servers. The development server and data display are provided by Scripps Institution of Oceanography’s Coastal Observing Research and Development Center, and its mirror is at the NOAA National Data Buoy Center while data failover redundancy is also provided at Rutgers University. Data file management and distribution follow internationally accepted standards, for example, netCDF-CF file and metadata formats and OpenGIS® Web Coverage Service Interface Standard for interoperable delivery of gridded data. Data delivery is accomplished using a THREDDS Data Server.
Capabilities and Description
One of the primary advantages of HF radars is the ability to see beyond the horizon when propagating over conductive sea water. This is not due to the atmosphere nor ionosphere. Rather, it is a “waveguide-type” effect. The vertically polarized electromagnetic waves attach to the mean spherical sea surface. The lower the HF frequency, the farther the signal reaches beyond the visible horizon. At 5 MHz (within IOOS, these are referred to as "long-range radars"), with modest transmit power, radar distances of 200 km are common even though the horizon for a microwave radar may be only 30 km away. Above 100 MHz, the signals become restricted to line of sight, the same as microwave and optical transmissions. However, none of the radars within the IOOS network uses transmit frequencies above 49.5 MHz. HF radar requires that the transmitted radio signal be conducted across the sea surface. Since freshwater is inherently 5,000 times less conductive than seawater, HF signals do not travel nearly as far over freshwater. As an example, a standard 12MHz signal might travel 90 km in the coastal ocean, but only about 5 km over one of the Great Lakes.
| Transmit Frequency (MHz) | Max Range*(km) | Range Resolution** (km) | Time Resolution (minutes) |
| 4.0-5.5 | 200 | 6 | 60 |
| 8.0-9.0 | 220 | 3 | 60 |
| 12.0-16.0 | 90 | 2 | 60 |
| 24.0-27.5 | 45 | 1 | 60 |
| 40.0-45.0 | 20 | 0.3 | 60 |
*Maximum ranges will vary slightly depending on sea state, amount of external interference and radar transmit antenna.
**Range resolution depends on the bandwidth used by the radar's transmit waveform. In practice, bandwidth is given by regulatory agencies and the resolutions shown here reflect typical bandwidths currently used.
- Accuracies of the radar-derived velocities, from numerous peer-reviewed studies, have been shown to be typically in the range 5-10 cm/s.
- Radar sites operate unattended and require relatively little maintenance.
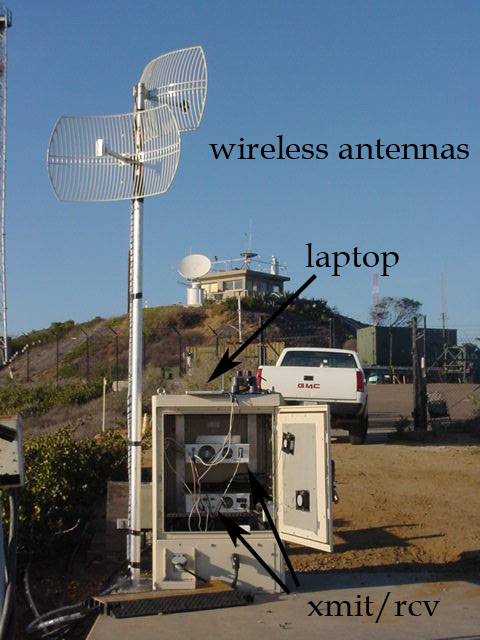
- Radar site infrastructure is minimal. Since it requires little space, the radar electronics hardware is often housed in a small portion of an existing structure or a small utility enclosure whose sophistication is mostly dependent on local climate (two examples shown below).

Small enclosure used in a temperate climate.
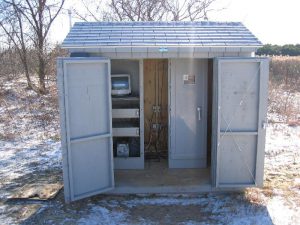
Typical enclosure used when air conditioning is necessary.

HF Radar Responsibilities
- Creating hourly gridded surface current total vector velocity data files at national servers located at the National Data Buoy Center (NDBC) HF radar data distribution and display server and Scripps Institution of Oceanography Coastal Observing Research & Development Center (CORDC) HF radar data distribution and display server.
- Delivering near-real-time data files via THREDDS on user demand at Scripps CORDC THREDDS Data Server or at NDBC.
- Delivering near-real-time data files to CO-OPS Tidal Data and Predictions.
- Delivering near-real-time data files to AWIPS-II in GRIB-2 format from NDBC for use at marine Weather Forecast Offices throughout US coastal areas.
Locations & Coverage
IOOS HF radars are located in nearly every coastal state in the continental USA as well as Alaska, Hawaii and Puerto Rico.
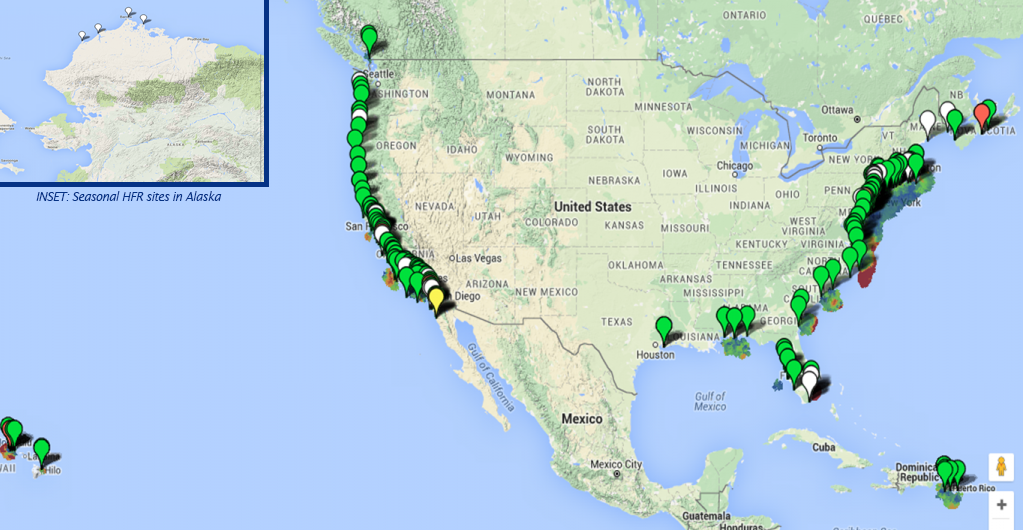
Map of HFR sites in the Continental United States, Hawaii, Puerto Rico, and Alaska (inset).
Our coverage maps illustrate the actual data returns from the sites for a given time period. In these images, the blue color indicates where data were available at least 10% of the time period. This can be thought of as the "optimal coverage" for the network. The green color indicates where data were available at least 80% of the time period. This might be thought of as a "typical obtainable coverage".
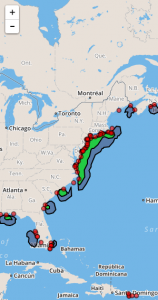 East and Gulf coast coverage for 6km resolution HFR data for FY2016 |
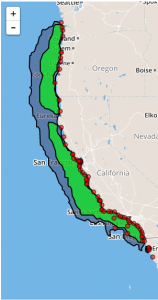 West coast coverage for 6km resolution HFR data for FY2016 |
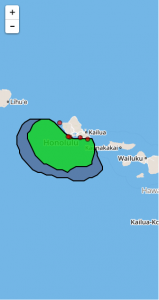 Hawaii coverage for 6km resolution HFR data for FY2016 |
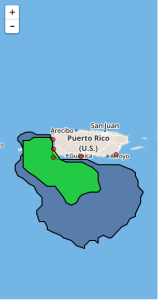 Puerto Rico coverage for 6km resolution HFR data for FY2016 |
For information about the proposed radar installation at Hightower Beach Park (FL), please visit this page.
Meeting Summaries
-
-
ROWG-9 Meeting, Galveston, Texas, 2017
Download (pdf, 90Kb) -
ROWG-8 Meeting, Woods Hole, Massachusetts, 2015
Download (pdf, 90Kb) -
ROWG-7 Meeting, San Francisco, California, 2014
Download (pdf, 79Kb) -
ROWG-6 Meeting, St. Petersburg, Florida, 2012
Download (pdf, 10Kb) -
ROWG-5 Meeting, Santa Barbara, California, 2011
Download (pdf, 156Kb) -
ROWG-4 Meeting, Norfolk, Virginia, 2009
Download (pdf, 81.2Kb)
-
ROWG-9 Meeting, Galveston, Texas, 2017
July 24-25, 2014 -
National HF Radar Technical Steering Team Annual Meeting,
Boulder, CO
- Summary (pdf)
April 16-17, 2013 -
National HF Radar Technical Steering Team Annual Meeting,
Boulder, CO
- Summary (pdf)
July 17-18, 2012 -
National HF Radar Technical Steering Team Annual Meeting,
Boulder, CO
- Summary (pdf)
July 19-20, 2011 -
National HF Radar Technical Steering Team Annual Meeting,
Boulder CO
- Summary (pdf, 32.7Kb)
July 28, 2010 -
National IOOS HF Radar Steering Team Inaugural Meeting,
Washington, DC
-
Agenda (pdf, 10Kb)
-
Meeting Notes (pdf, 26Kb)
-
Terms of Reference (pdf, 14Kb)
Technical Documents
A Plan to Meet the Nation’s Needs for Surface Current Mapping (updated May 2015) (pdf)
This plan presents the uses of high frequency radar, the requirements that drive the measurement of ocean surface currents, and the implementation design for a five-year, national build-out effort.
IOOS Spare Parts Process for CODAR SeaSondes (pdf), Sep 2015
HF Radar Data Archiving at NCEI (formerly NODC) (pdf), Sep 2014
Final ITU Document HF Ocean Radar (pdf), 2014
Summary of WRC-12 HF Radar Frequency Outcomes (pdf), 2012
IOOS HF Radar Data and Its Use by the U.S. Coast Guard for Search and Rescue (pdf), 2012
National HF Radar Technical Steering Team Position Paper on Use of HF Radar in Freshwater (pdf), Aug 2012
National HF Radar Technical Steering Team Position Paper on Use of HF Radar for Wave Measurement (pdf), Aug 2012
IOOS HF Radar Network Overview, Marine Technology Society Journal, Harlan et al (pdf), Nov 2010
Bibliography of HF Radar Comparisons with Other Sensors (pdf), 2007
Search and Rescue Operations Environmental Data Sources: Their Uncertainties (pdf), 2006
News
November 2020 - ROWG-11 Meeting was held virtually for the first time. With over 90 participants from 9+ countries, ROWG-11 was the most well attended to date. Meeting presentations are posted at rowg.org.
July 2018 - ROWG-10 Meeting was held at the Monterey Bay National Marine Sanctuary Exploration Center. Please visit the information page for a description of the meeting and rowg.org for copies of presentations
October 2017 - The IOOS HF radar network data management group has been funded to produce a new product: Monthly and Annual Averages of HF radar-derived Coastal Surface Currents. The data can be accessed via THREDDS here. And, a description of the data type can be found here.
July 2017 - A new way to view all the radars in the IOOS HF radar network. This allows you to sort a list of all radars in a number of different ways and to download the list for input to spreadsheets.
March 2017 - ROWG-9 Meeting was held at Texas A&M University-Galveston. There were 32 attendees from six countries. Meeting presentations are posted at rowg.org. (NOTE: ROWG.org is a wiki so registration is required and is moderated. Therefore, one’s access will not be immediate)
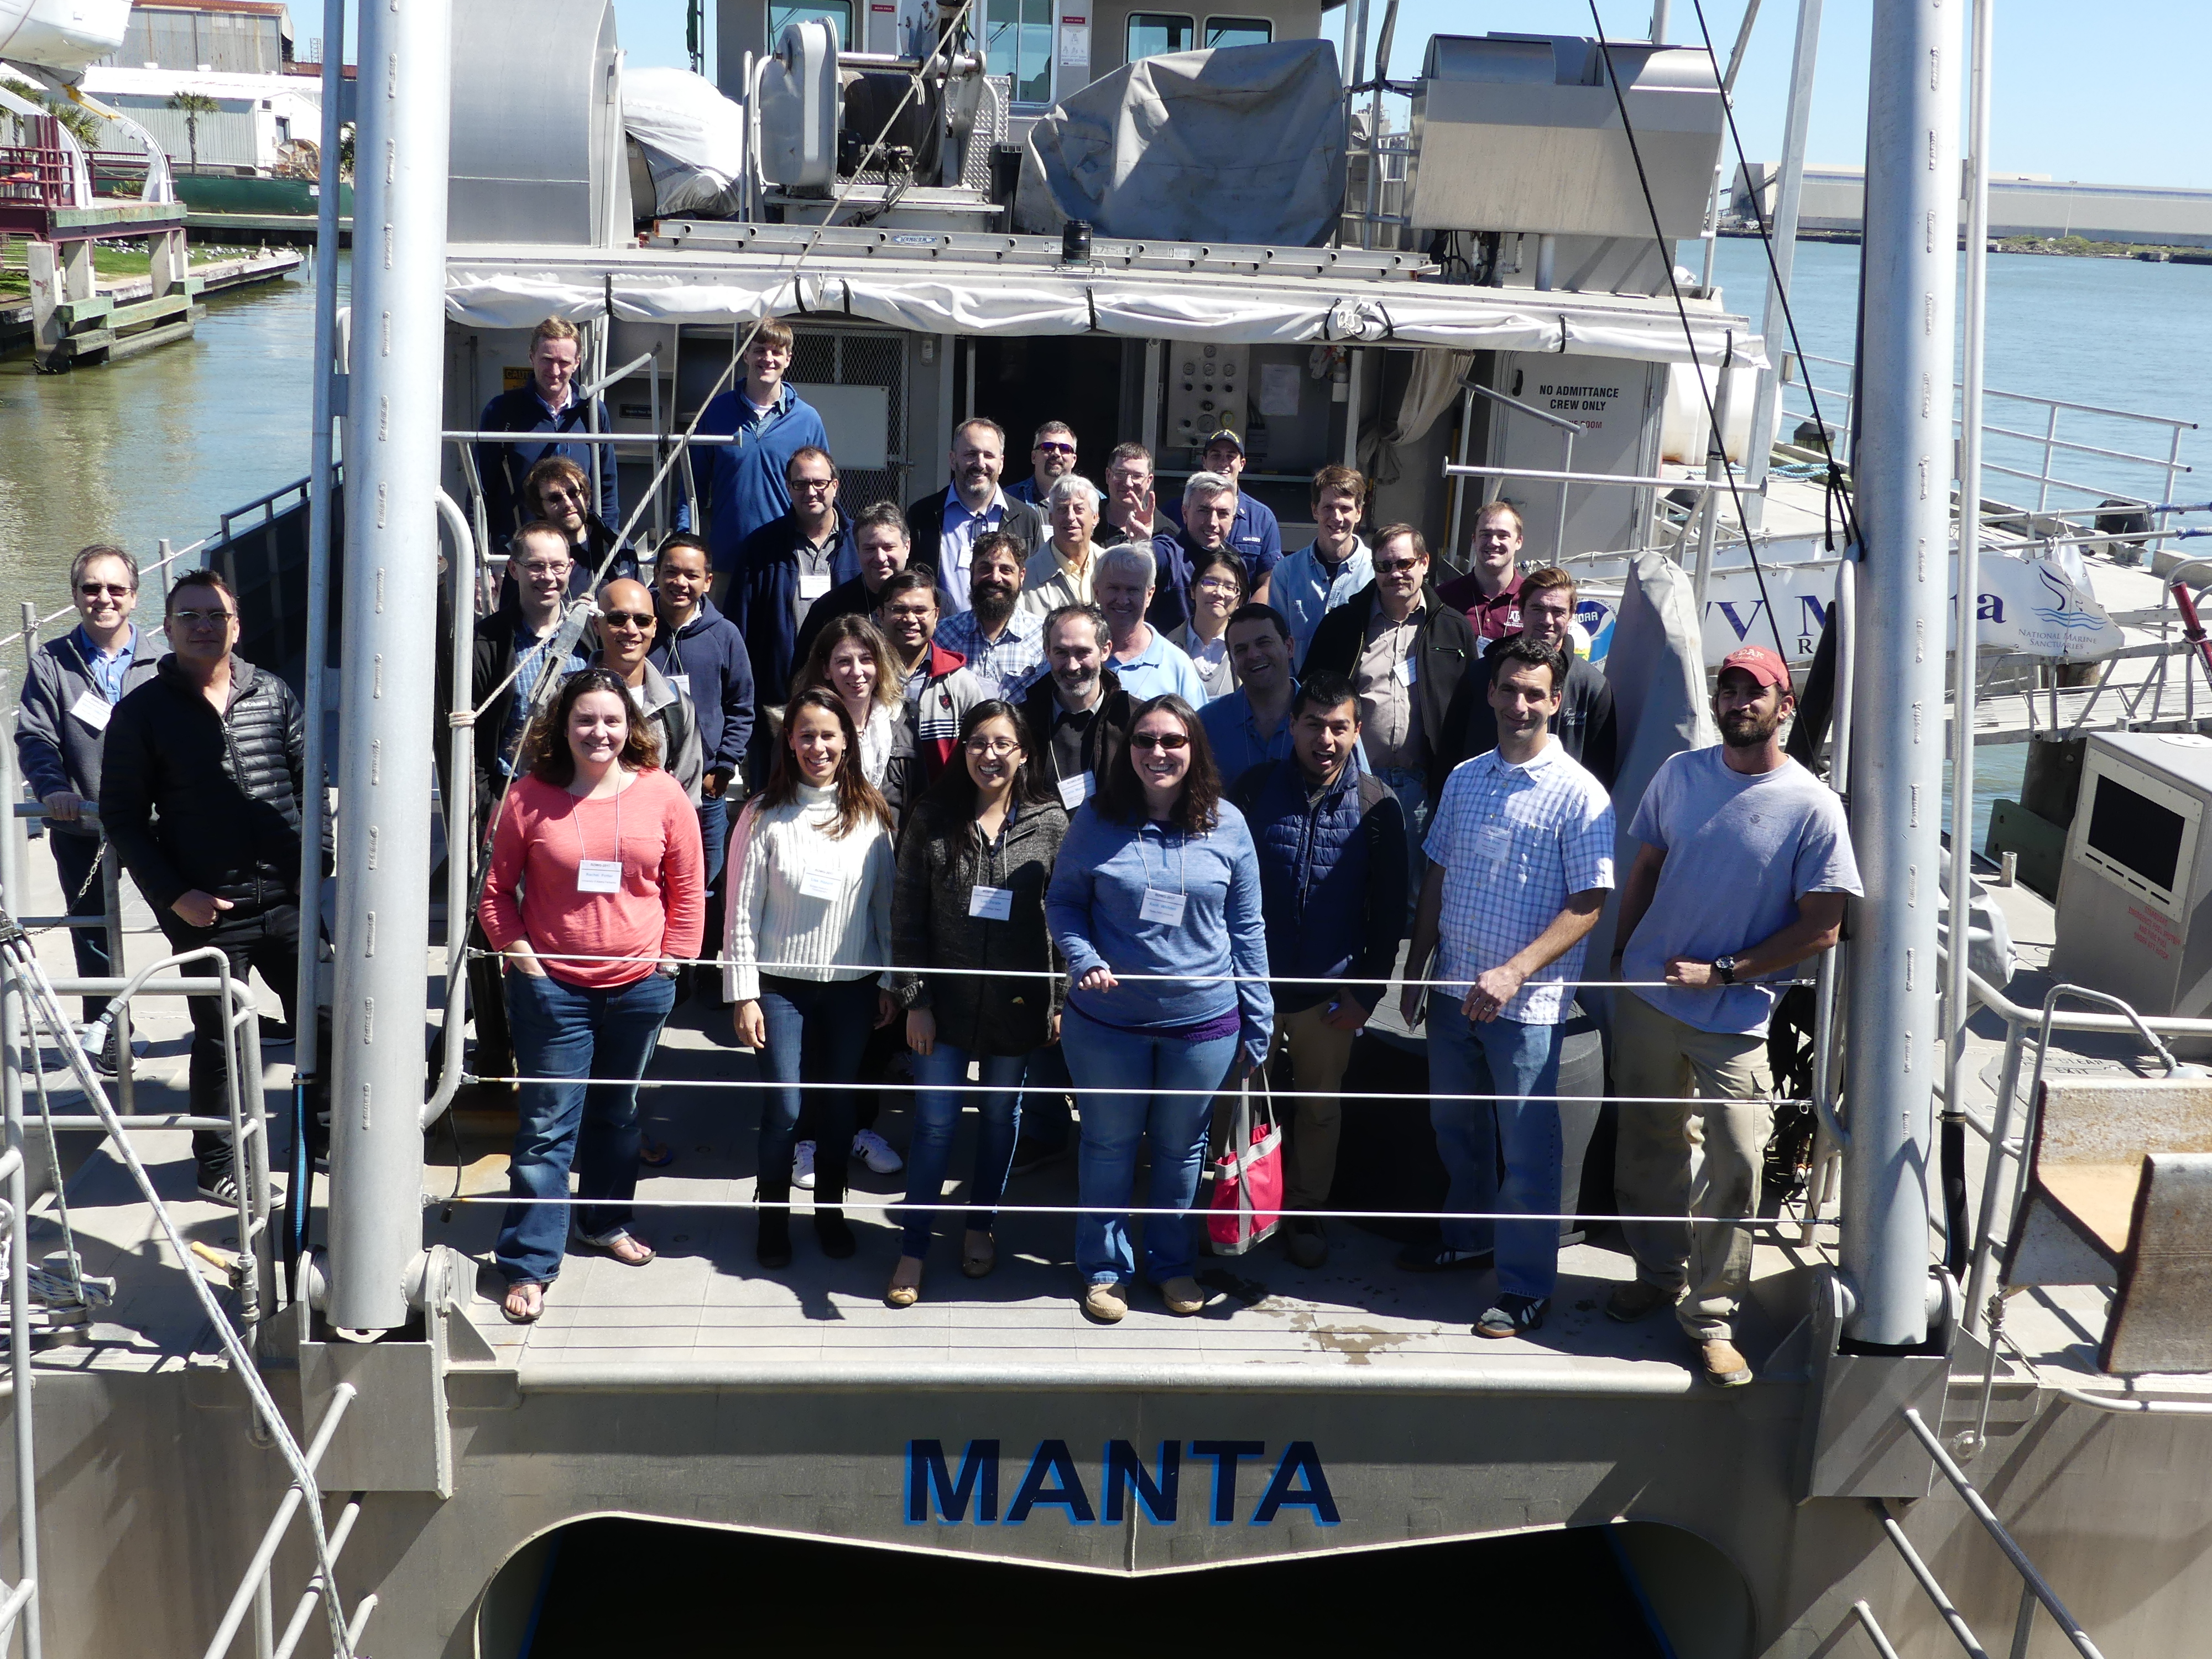
ROWG 2017 Attendees onboard NOAA R/V Manta
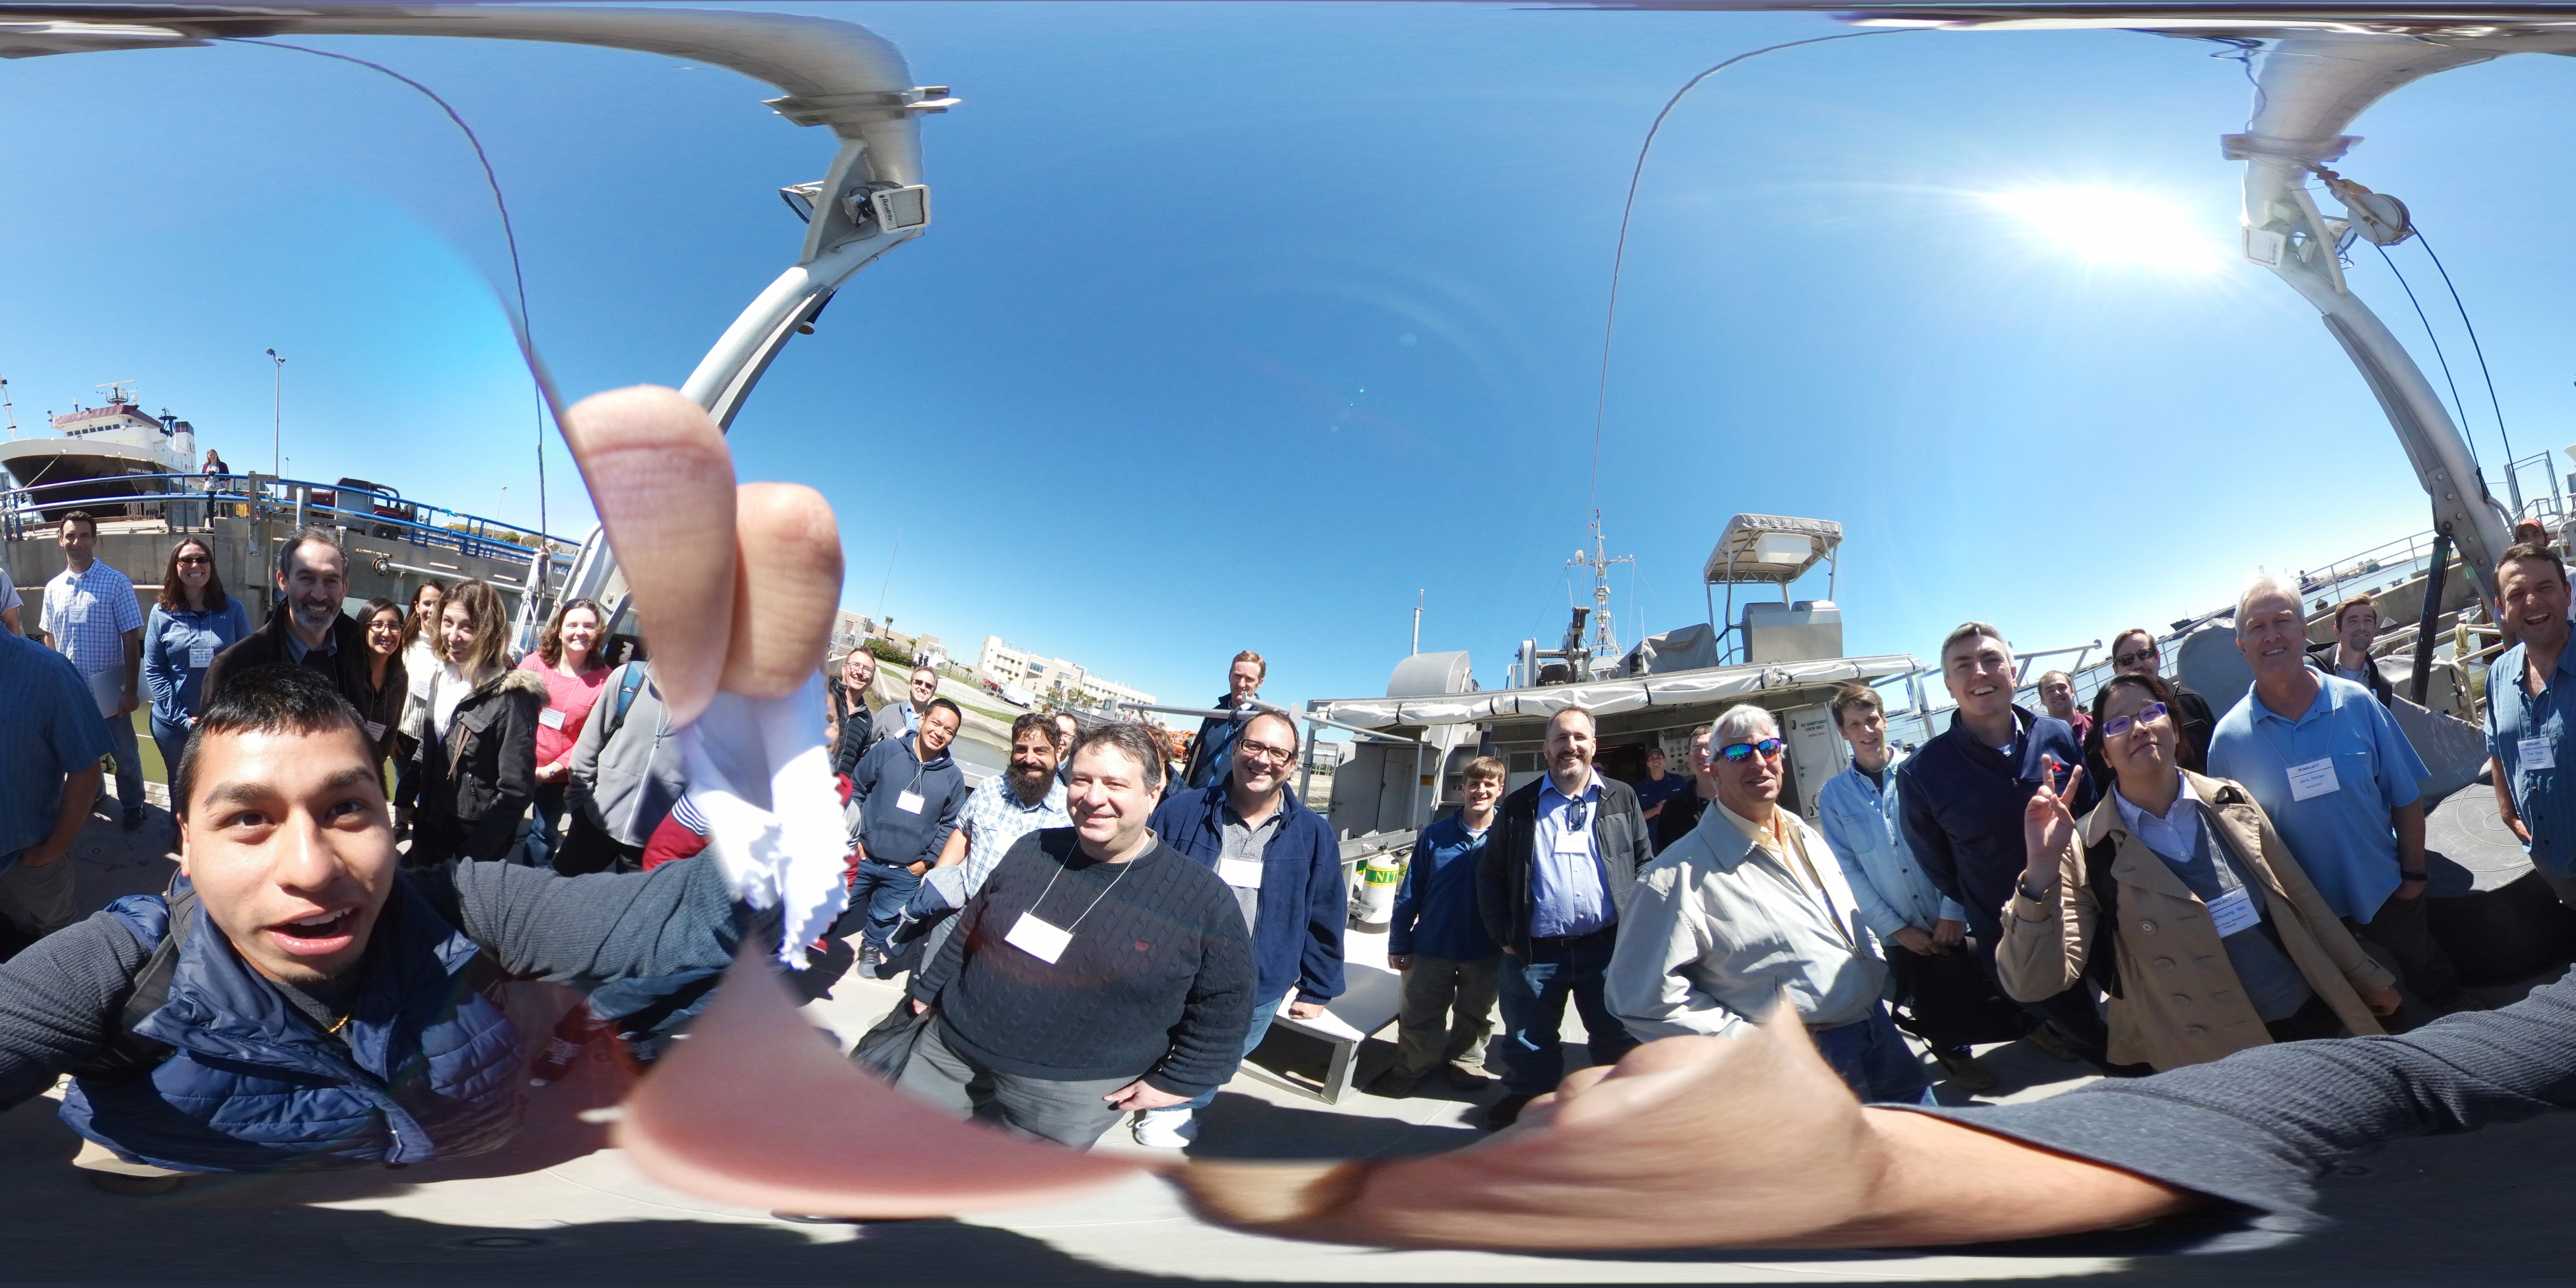
360 Degree View
January 2017 - HF Radar Video Released: The IOOS Program teamed up with UCAR COMET to produce a video "High-Frequency Radar: Supporting Critical Coastal Operations with Real-time Surface Current Data". It is on Youtube here.
December 2016 - ROWG-9, 14-15 March 2017 will be held at Texas A&M University-Galveston. To register and for more information, go to the planning page.
October 2016 - The Global HF Radar website has been completely remodeled and is now here.