 An official website of the United States government.
  Official websites use .gov
A .gov website belongs to an official government organization in the United States.
Official websites use .gov
A .gov website belongs to an official government organization in the United States. Secure .gov websites use HTTPS
A lock or https:// means you’ve safely connected to the .gov website. Share sensitive information only on official, secure websites..
Secure .gov websites use HTTPS
A lock or https:// means you’ve safely connected to the .gov website. Share sensitive information only on official, secure websites..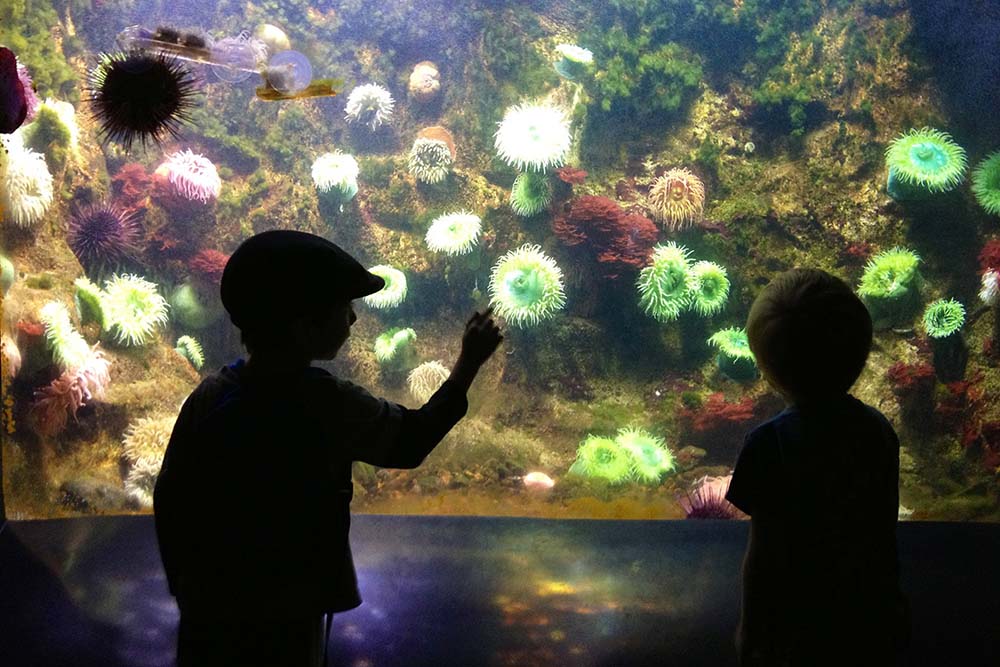
Children discover ocean life at the Smithsonian National Zoo's invertebrates exhibit in Washington, DC. Photo Credit: NOS/NOAA
Ocean observing is a complex and rich subject. Here, we have gathered formal and informal educational resources offered by U.S. IOOS® and our regional associations to help explore ocean observing in the context of physical, chemical, geological, and biological changes in our oceans, coasts, and Great Lakes.
Using Real Data
The integration of real world data into classroom instruction is a powerful means to increase student interest and understanding of concepts. U.S. IOOS provides this real observation data for use in education.
Satellite Tracking
Grades: 9-12
Students use satellite tagging data to follow the movement of marine animals over time. Examining satellite maps of sea Surface Temperature (SST) and chlorophyll-a data combined with satellite tagging data, students answer questions related to open-ocean animals, their habitats and migratory behaviors. This is a free 3-week online workshop offered by COSEE-West and the College of Exploration. Graduate credit is available for this workshop.
Conditions at Sea
Grades: 6-12
Forecasting conditions at sea is an important tool for sailors, fishers, maritime transportation, and anyone on the water. In Conditions at Sea, a three-part series, students first learn about the concepts of wave formation and forecasting, conduct an in-class wave-making activity, and access near real-time and real-time data from ocean observing buoys to investigate the relationship between wind and wave height, and to predict actual conditions at sea using the Beaufort scale.
Water Column Profiles
Grades: 6-12
Students access and retrieve water column profile data from NANOOS and the WA Department of Ecology's Marine Water Monitoring database. Using this data, students construct water column profiles and provide plausible explanations for why the profile looks as it does.
Well, Well, Well
Grades: 6-12
Students investigate the relationship between winds, surface currents, sea surface temperature, and upwelling and downwelling off the coast of OR and WA. Students analyze data to make predictions on today's upwelling or downwelling conditions.
Interactive Computer Exhibit
Grades: 6-12
Check out what happens to salinity, or the amount of salt in the water, in an estuary located in Newport, OR. This exhibit is physically located in the Hatfield Marine Science Center Visitors Center and was created to help you, the general public, make sense of what is happening in the bays and estuaries in the Pacific Northwest.
Lesson Plans
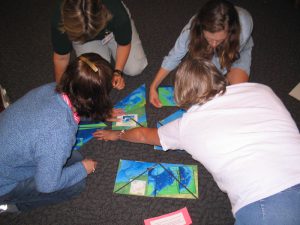
Working on an ocean observing puzzle
These lessons present ocean observing science through activities using ocean observing information.
Home, Home on the Beach
Grades: 5-8, 9-12
NSES: B,D,E,G
Investigate the effects of storm wave action on man made structures on a beach or island and determine the best place to build an ocean front structure on an island
Making Waves
Grades: 5-8, 9-12
NSES: A, B, G
Investigate the effects of waves on beaches and the differences between summer and winter waves.
Wind Waves
Grades: K-4, 5-8, 9-12
NSES: A, B, G
Investigate the effects of storm wave action on man made structures on a beach or island and determine the best place to build an ocean front structure on an island.
Wave Size and Depth
Grades: 5-8, 9-12
NSES: A, B, G
Investigate the relationship between the size of a wave and the depth to which the effects of its energy can be observed.
Forecasting Conditions at Sea
Subject: Earth/Physical Science
Grade: 6-12
Forecasting conditions at sea is an important tool for sailors, fishers, maritime transportation, and anyone on the water. In Conditions at Sea, a three-part series, students first learn about the concepts of wave formation and forecasting, conduct an in-class wave-making activity, and access near real-time and real-time data from ocean observing buoys to investigate the relationship between wind and wave height, and to predict actual conditions at sea using the Beaufort scale.
Ocean Observation
Subject: Earth/Physical Science
Grade: 6-12
This activity will familiarize students with methods scientists use to study the coastal ocean in the Pacific Northwest, and will encourage them to pose and investigate their own questions about the ocean.
Satellite Tracking
Subject: Earth/Biology Science
Grade: 9-12
Students use satellite tagging data to follow the movement of marine animals over time. Examining satellite maps of Sea Surface Temperature (SST) and chlorophyll-a data, combined with satellite tagging data, students answer questions related to open-ocean animals, their habitats and migratory behaviors.
Water Column Profiles
Subject: Earth/Biology Science
Students access and retrieve water column profile data from NANOOS and the WA Department of Ecology's Marine Water Monitoring database. Using this data, students construct water column profiles and provide plausible explanations for why the profile looks as it does.
Well, Well, Well
Subject: Earth/Biology Science
Students investigate the relationship between winds, surface currents, sea surface temperature and upwelling and downwelling off the coast of OR and WA. Students analyze data to make predictions on today's upwelling or downwelling conditions.
Virtual Hurricanes
Grades: K-12
Take your students by storm using the SECOORA virtual hurricane classroom – featuring an “eye”-catching poster, hurricane information and activity websites, a hurricane glossary, and classroom activities.
Regional Educational Websites
Alaska
Regional Associations of the U.S. Integrated Ocean Observing System
- Alaska Centers for Ocean Sciences Education Excellence (COSEE) is a close-knit team of ocean scientists, communicators and educators from the Alaska region who Work closely with ocean scientists, educators and coastal community members, COSEE Alaska seeks to enhance ocean and climate change literacy in formal and informal audiences and the public.
- AOOS offers documents and records from workshops and reports online.
Caribbean
- CARICOOS Outreach & Education provides data visualization of waves, winds, currents, water quality and coastal flooding in real time to the various users of coastal waters such as recreational and commercial fishermen, surfers, swimmers, sailors, students, researchers, government regulatory agencies, and emergency management agencies, among others.
Central and Northern California
- CeNCOOS Learn provides educational products for people of all ages to learn about CeNCOOS and topics related to ocean observing in the region.
- EARTH: Education and Research: Testing Hypotheses uses near-real-time data from ocean observatories to design and test outreach with the Internet as an interface to scientists, teachers, students, and the public.
Great Lakes
- Teaching Great Lakes Science offers Great Lakes lessons and activities, data sets and tools.
Gulf of Mexico
- Visit COSEE Gulf of Mexico for the "Making Waves" poster, lessons, real-time wave information on the web, learn the wave vocabulary with the waves glossary, and more. COSEE Southeast and COSEE Gulf of Mexico are SECOORA education partners in developing these materials.
- GCOOS Education & Lesson Plans offers formal and informal education resources centered around ocean and weather information for the Gulf Coast – from Florida to Texas.
Mid-Atlantic
- MARACOOS Education seeks to educate users on end product delivery and understanding. Through workshops, programs, studies, pilot projects and collaborations, MARACOOS hopes to educate the many users of ocean observation data.
Northeastern Atlantic
- NERACOOS Education offers resources ranging from teacher workshops, university programs and lectures to education and outreach materials.
Pacific Islands
- PacIOOS Education & Outreach offers climate change resources, coral bleaching, sea level rise and more.
- Voyager Lesson Plan: In this lesson plan, students make decisions for ocean recreational activities with which they are familiar. This approach to education and outreach motivates students to delve deeper into the data generated and served by their local ocean observing system through decision-making that is relevant to students’ lives.
Pacific Northwest
- NANOOS Education offers learning tools, lesson plans and links to marine resources for teachers and students.
Southern California
- http://www.sccoos.org/commclass.html explores topics like defining an ocean observing system: surface current mapping, metereological stations, automated shore stations, manual shore stations, and more. Teacher resources, professional development, real time data in the classroom and more.
Southeast
- SECOORA's Classroom has K-12 resources based on ocean observations, lesson plans, and real-time data: this website is for ocean users, teachers, and other educators to learn how ocean observing information can be used or incorporated into classroom and other educational programs.
- SECOORA is dedicated to training the next generation of ocean experts. Check back to this page to see what opportunities are available throughout the year.
 Contact
Know of a program or opportunity you think should be listed here? Let us know!